
Optimizing Models using Saliency Maps and CMVs
Motivation
There are multiple ways to understand how the model of a NN is working, amongst its cost, loss, precision, recall, f1, etc. The couple of strategies listed here can be used in tandem with other methods when understanding how a model is performing.
Similar to occlusion maps we can get gain additional information visually on how the model is processing the input data. Consider a project where the model is trying to identify wolves vs huskies. Both dogs look similar but most huskies have a snowy background. The model might start classifying the snowy background instead of the husky. These two methods are a way to use visualization to understand if that’s what’s happening.
Method 1 - Class Model Visualization
This method generates an artificial image that maximizes the class score. Depending on if you use the unnormalized class score vs the class posterior returned by softmax, you’ll get results that are more visually recognizable to the human eye. We expect the results to highlight the structures and patterns that the model “looks for” when recognizing an element.
As an example, when a human looks at a goose, what types of features do we think are characteristics that define the goose class. Looking at a goose (at least from afar) we may think about the following:
- long neck
- oval body
- long legs
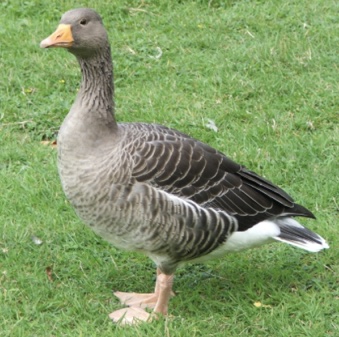
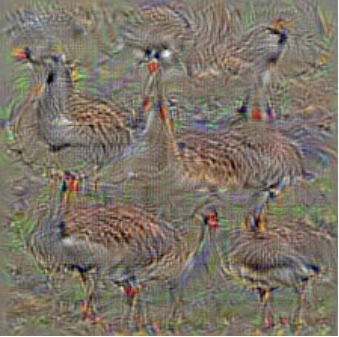
Using a class model visualization we see the listed characteristics are exactly the types of features that are highlighted by the intermediate neurons. Because it is using those features and not the grass, we can assume our networks are correctly using those features.
Method 2 - Saliency Map
The saliency map shows us the rank of the pixels based on their influence for scoring a given image into a class using that particular scoring function. When thinking about a linear score model for a class, we know the weights tells the importance of those corresponding pixels when classifying into a particular class. In a non-linear function such as CNNs, although not able to be directly applied, can still be approximated with the linear function.
Although, a great tool for a first pass, there are a few downsides that should be considered when using saliency maps.
- The pixels are very entangled with other pixels and far removed from high-level concepts
- They only show the attribution for one class which makes exploration across a range of classes, or between two classes, really tough.
With that said, it’s still a great tool for certain situations.
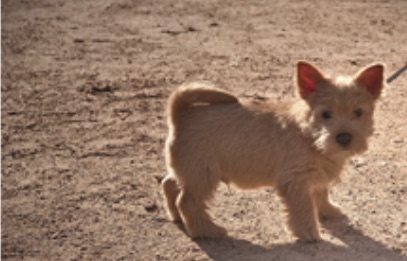
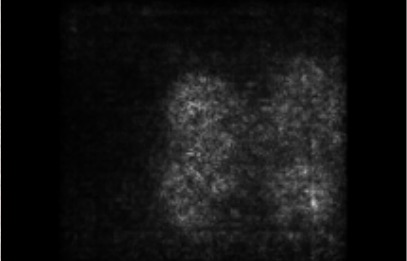
For this Westie, the saliency maps shows where the most important features are. This coincides with the human understanding of where to look in the photo to accurate identify the features of the dog. As in the example in beginning of this article, if the saliency map was showing activation in the background, there could be a problem worth debugging.
Conclusion
This idea of exploring the intermediate layers of the neural network has many methods that give different insight into a model. New methods of visualization for optimization are often coming out from the Google team so it’s always good to check there for new approaches.